When you buy shares in a company, it’s worth keeping in mind the possibility that it could fail, and you could lose your money. But on the bright side, you can make far more than 100% on a really good stock. Long term Tung Ho Steel Enterprise Corporation (TWSE:2006) shareholders would be well aware of this, since the stock is up 117% in five years. Better yet, the share price has risen 3.3% in the last week. But this might be partly because the broader market had a good week last week, gaining 1.8%.
The past week has proven to be lucrative for Tung Ho Steel Enterprise investors, so let’s see if fundamentals drove the company’s five-year performance.
View our latest analysis for Tung Ho Steel Enterprise
While markets are a powerful pricing mechanism, share prices reflect investor sentiment, not just underlying business performance. One imperfect but simple way to consider how the market perception of a company has shifted is to compare the change in the earnings per share (EPS) with the share price movement.
During five years of share price growth, Tung Ho Steel Enterprise achieved compound earnings per share (EPS) growth of 37% per year. The EPS growth is more impressive than the yearly share price gain of 17% over the same period. So one could conclude that the broader market has become more cautious towards the stock. The reasonably low P/E ratio of 11.08 also suggests market apprehension.
The company’s earnings per share (over time) is depicted in the image below (click to see the exact numbers).
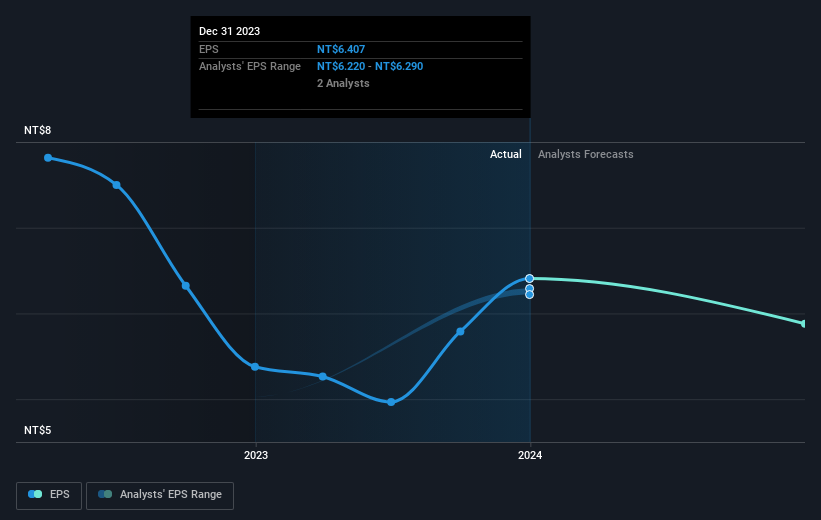
We know that Tung Ho Steel Enterprise has improved its bottom line lately, but is it going to grow revenue? Check if analysts think Tung Ho Steel Enterprise will grow revenue in the future.
What About Dividends?
When looking at investment returns, it is important to consider the difference between total shareholder return (TSR) and share price return. Whereas the share price return only reflects the change in the share price, the TSR includes the value of dividends (assuming they were reinvested) and the benefit of any discounted capital raising or spin-off. Arguably, the TSR gives a more comprehensive picture of the return generated by a stock. In the case of Tung Ho Steel Enterprise, it has a TSR of 229% for the last 5 years. That exceeds its share price return that we previously mentioned. And there’s no prize for guessing that the dividend payments largely explain the divergence!
A Different Perspective
Tung Ho Steel Enterprise’s TSR for the year was broadly in line with the market average, at 34%. Most would be happy with a gain, and it helps that the year’s return is actually better than the average return over five years, which was 27%. Even if the share price growth slows down from here, there’s a good chance that this is business worth watching in the long term. It’s always interesting to track share price performance over the longer term. But to understand Tung Ho Steel Enterprise better, we need to consider many other factors. Even so, be aware that Tung Ho Steel Enterprise is showing 2 warning signs in our investment analysis , you should know about…
For those who like to find winning investments this free list of growing companies with recent insider purchasing, could be just the ticket.
Please note, the market returns quoted in this article reflect the market weighted average returns of stocks that currently trade on Taiwanese exchanges.
Valuation is complex, but we’re helping make it simple.
Find out whether Tung Ho Steel Enterprise is potentially over or undervalued by checking out our comprehensive analysis, which includes fair value estimates, risks and warnings, dividends, insider transactions and financial health.
Have feedback on this article? Concerned about the content? Get in touch with us directly. Alternatively, email editorial-team (at) simplywallst.com.
This article by Simply Wall St is general in nature. We provide commentary based on historical data and analyst forecasts only using an unbiased methodology and our articles are not intended to be financial advice. It does not constitute a recommendation to buy or sell any stock, and does not take account of your objectives, or your financial situation. We aim to bring you long-term focused analysis driven by fundamental data. Note that our analysis may not factor in the latest price-sensitive company announcements or qualitative material. Simply Wall St has no position in any stocks mentioned.


