This article is an on-site version of our Unhedged newsletter. Sign up here to get the newsletter sent straight to your inbox every weekday
Good morning. Congratulations to Disney’s Bob Iger, who won a shareholder vote against the activist Nelson Peltz yesterday. Hopefully now Iger can take Disney back to its roots: sticky, crowded theme parks and training children to annoy parents until they buy high-margin merch. If your child has a Frozen II Nerf gun they used once and never again, email us: robert.armstrong@ft.com and ethan.wu@ft.com.
The US economy is less confusing now
Several times last year, Unhedged wrote pieces making the dumb point that the pandemic-rattled US economy was confusing. In September, for instance:
The cycle is hard to read when you are living inside of it. It is even harder to read while supply and sectoral disruptions are rippling through the economy, since the archetypical cycle is about demand fluctuations.
Since the shocks of the pandemic, the cycle has been so inscrutable that some people think we are at the beginning of it while others think we are at the end.
It’s now incumbent on us to make the opposite dumb point: the US economy has become a lot less confusing. The economy is growing roughly at, or possibly a bit above, its long-term potential. Inflation is not back to target, but it’s close. Consumer confidence, long depressed and much debated, has in recent months begun to rise.
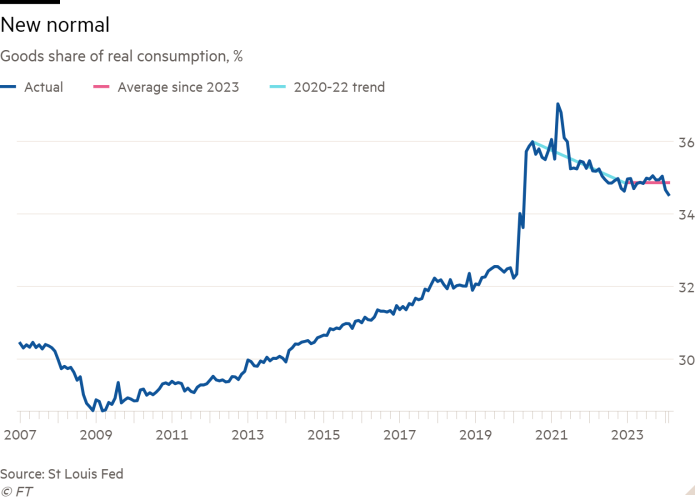
Most importantly, sectoral shifts and supply shocks have settled down. The New York Fed’s global supply chain disruption index has been bang in line with the long-run average since November 2023, shrugging off a clogged Panama Canal and war-stricken Red Sea. The goods-to-services spending rotation, after enduring two years of volatility, found an equilibrium in 2023 and has stayed there since (despite a small recent blip in the chart below):
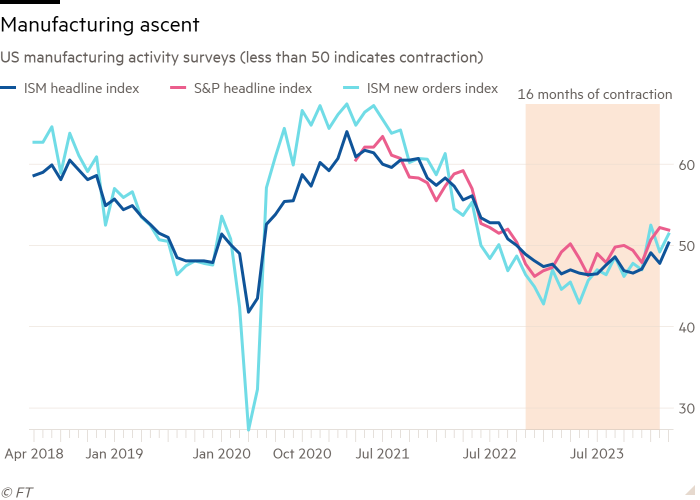
Steadier goods spending and lower cost inflation seem to have relieved pressure on US manufacturing. This week’s ISM purchasing managers’ index confirmed that manufacturing returned to modest expansion in March, after 16 months in contraction. In cycles since 1951, ISM manufacturing surveys have never shrunk for more than 14 months without a recession, note Don Rissmiller and Brandon Fontaine of Strategas. Manufacturing leaving contraction nixes one of the economy’s last few soft spots:
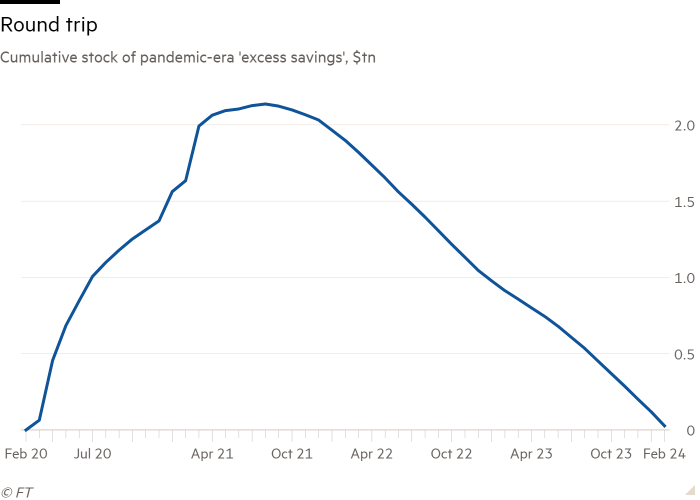
Consumer balance sheets have normalised. The pick-up in credit card and auto loan distress has been widely noted, and for now both look like a return to the pre-pandemic world. The famous “excess savings” of the Covid-19 era appear exhausted. (Excess savings is a slippery concept, hard to interpret and even harder to measure. It is generally defined as the aggregate amount of personal savings above what the pre-pandemic trend would imply. This has probably supported consumer spending.) The latest update to the San Francisco Fed’s excess savings measure verges on zero:
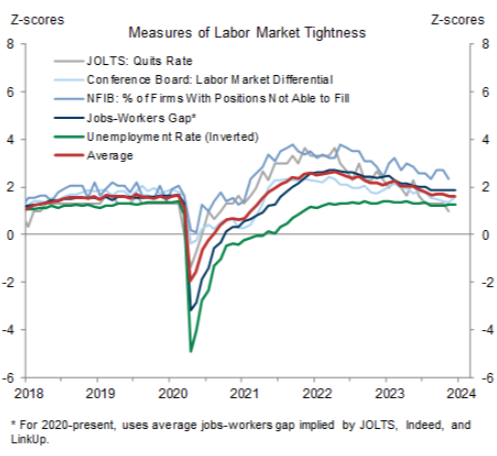
The labour market is still on the tight side, but far closer to 2019 levels of tightness than the 2021-22 quitters’ market. The Jolts data published earlier this week underscores the point. Across quits, firings, job openings and hiring, there was little to see, and as Nick Bunker, economist at Indeed, noted on Tuesday, “Today’s Jolts report reminded me of boring reports circa 2018. They were snoozefests on a month-over-month basis, but were signalling a strong labour market.” Goldman Sachs’ labour market tightness tracker (red line below) is back to where it was in 2019:
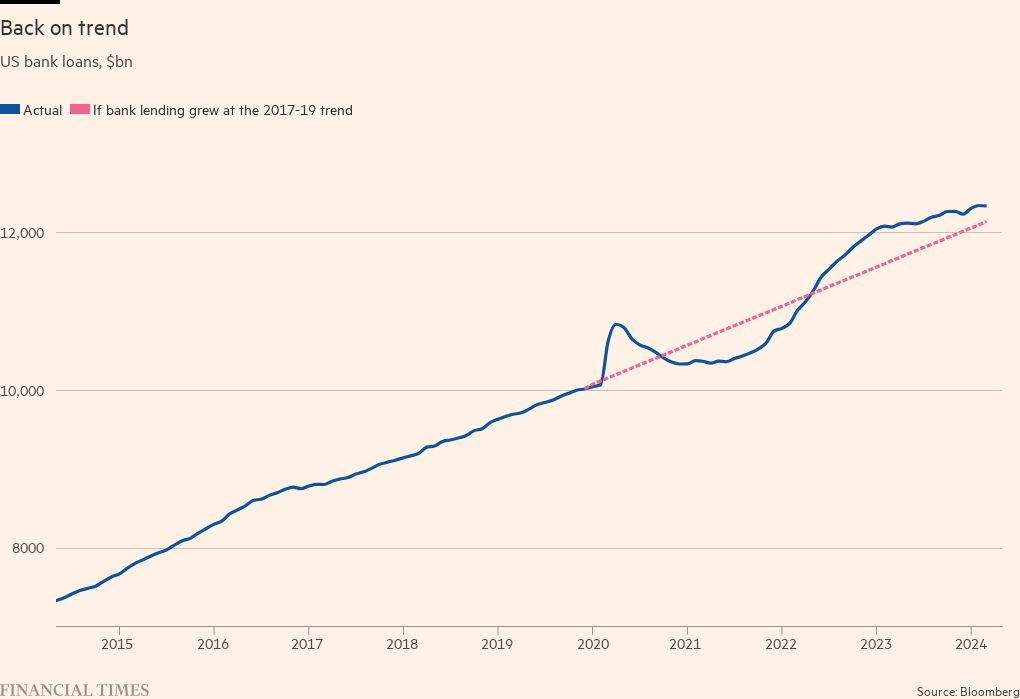
After a rip-roaring boom in 2022, bank credit growth decelerated throughout 2023 and has closed in on the pre-pandemic trend. Looking at credit levels against a trend line is helpful, because volatile base effects make recent growth rates hard to interpret. Overall bank lending is about 2 per cent above the 2017-19 trend (see chart below), offset by cyclically sensitive commercial and industrial lending about 3 per cent below trend. The broad picture is one of normalisation, though weak C&I lending is notable.
The big exception is housing. As we’ve written about many times, high rates have frozen the market. They have locked up existing-home supply (no one will give up their 3 per cent fixed rate) and squelched mortgage demand. Without lower mortgage rates, a thaw is unlikely.
This is likely why the Fed is taking its time to cut rates: it fears a housing snapback while the economy is already running somewhat hot. It must choose between risking an inflationary boom that could force further rate increases, or holding firm on rates at the risk of further damage to housing. To us, leaning against inflation seems the better choice, especially given how resilient growth has been. But the irony is that housing, the final abnormality, may be what is enabling so much normalisation elsewhere. (Ethan Wu)
Utilities might not be boring
The problem with any analysis of the utilities industry is that people are unlikely to read it. Boredom, after all, is utilities’ primary characteristic as an investment. Steady demand, regulated returns, no surprises. If you have read even this far in this section of the letter, you are a hearty soul.
That said, I assert that this chart is actually quite interesting:
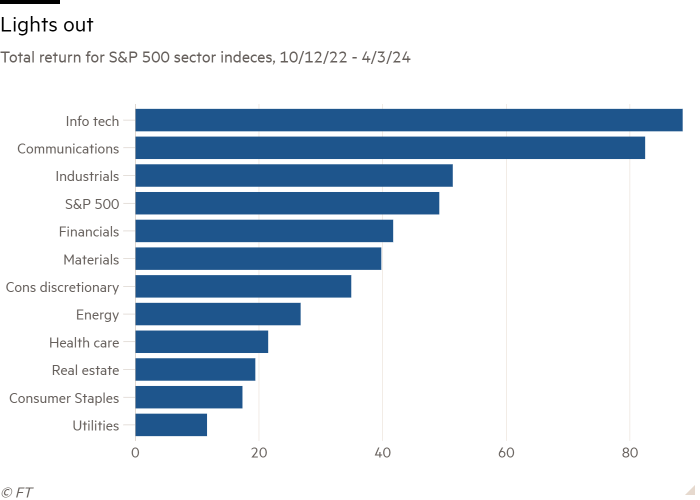
That is the total return of the S&P 500 sectors since this current rally began in October 2022. Utilities’ performance is not only the worst, it’s by far the worst, trailing the index by a whopping 38 percentage points.
This is excitement — of a sort — at last. If you believe that, sooner or later, markets revert towards the mean, utilities are setting up for an absolutely glorious reversion. And this has happened in the past: in 2011 and 2014, for example, after several years of underperformance, utilities’ returns roared back and crushed the market by 15 and 18 percentage points, respectively. Utility outperformance is not limited to recessions and big market corrections.
The problem in recent years has been obvious enough. Most investors buy utilities for their dividend yields, as a bond substitute. But since the pandemic began, bond yields have risen, and utilities’ yields have not.
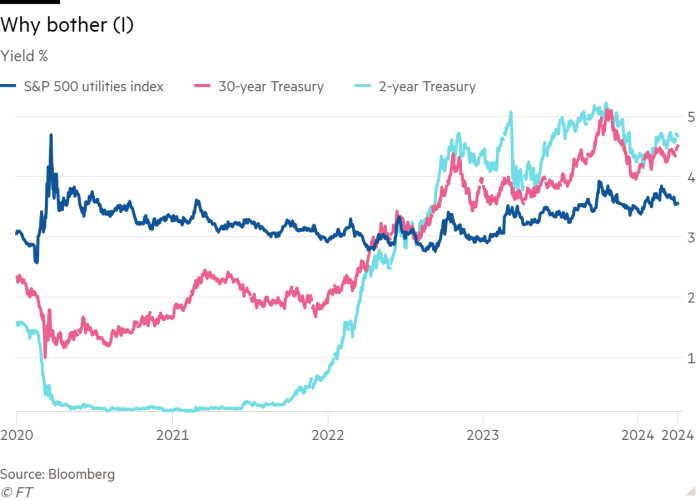
In 2020, you were getting 2 percentage points of extra yield for owning utilities versus the 30-year Treasury. Today you get a percentage point less. And today you don’t even have to take duration risk to earn income, if you don’t want to. You can get the same yield on the two-year. Why on earth would you own utilities?
The problem may be worse than this. Looking at the first chart, you will notice that of the four worst-performing sectors, two are rate-sensitive (utilities and real estate). But the other two are defensive (healthcare and consumer staples). Yields aside, defensiveness is unpopular in itself lately.
Utilities should make a comeback when inflation finally arrives at target and the Fed begins to cut rates. How big, though? The increase in Treasury yields does not just reflect inflation. Real interest rates have risen too, and may stay high even in the face of Fed cuts.
Still, they are due a snapback eventually. It would be nice if they were slightly cheaper, though, in dividend yield or even price/earnings terms. If you screen for utility companies that have solid yields, reasonable debt levels and have consistently grown both dividends and shareholder equity, you get a list like the one below. The compound annual growth rates in the chart are from 2019-23:
Tempted? Email us.
One good read
FT Unhedged podcast
Can’t get enough of Unhedged? Listen to our new podcast, hosted by Ethan Wu and Katie Martin, for a 15-minute dive into the latest markets news and financial headlines, twice a week. Catch up on past editions of the newsletter here.


