Bitcoin price made a surprise move this week blasting to $64,000 from an important support area above $50,000 on Monday. This massive uptick has changed both the short-term and long-term landscape of not only Bitcoin but also other crypto to HODL, including Shiba Inu (SHIB), Dogecoin (DOGE), and XRP.
The ETF happens to be the biggest market mover since the approval in January. With over $7.49 billion in cumulative total net inflow, demand for BTC is surging and sending Bitcoin price ballistic.
Although the rally was witnessed across the market, some altcoins like SHIB emerged as top gainers, increasing by more than 50% in a week.
Investors will carefully gauge Bitcoin’s behavior in the next few days to ascertain the validity of the uptrend to $70,000 or a correction to collect liquidity for another major breakout.
1. Bitcoin (BTC)
The supply and demand landscape for Bitcoin continues to change, driven by increasing ETF inflows. On top of this, investors are preferring to hold onto their BTC in anticipation of a larger breakout post-halving in February.
Bitcoin’s halving, which cuts miner rewards by half every four years. The last halving took place in 2020, placing the next event in 2024 around April.
In addition to giving Bitcoin its deflationary status, halving significantly reduces the amount of new coins joining the ecosystem. Remember miner rewards will come down to 3.125 BTC from the current 6.25 BTC.
It is this gradual decrease in supply coupled with demand increasing or staying the same that tends to drive Bitcoin price parabolically higher. The ETF is also expected to have a major impact on BTC as demand soars.
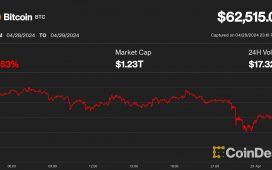
The area at $63,000 represents a sell wall that must be weakened to allow for gains above $64,000 (the red line on the chart). A break above this would trigger more FOMO with market participants targeting a sweep of the all-time high followed by a leg up beyond $70,000.
2. Shiba Inu (SHIB)
Like many cryptocurrencies in the market, Shiba Inu Coin faced increasing uncertainty in January, resulting in a correction below the $0.00001 level. The meme coin swept liquidity at $0.0000082 — 2024’s lowest point followed by a steady consolidation above $0.000009 ahead of this week’s massive breakout to $0.00001467.
A minor dip in the Moving Average Convergence Divergence (MACD) threatens to slow down the uptrend. By encouraging traders to close their positions.
However, this condition may not hold or last considering the Money Flow Index (RSI) is neutral and rolling upwards, indicating that liquidity is increasing for another leg up. Several four-hour closes below the yellow support line could see BTC drop to retest the $60,000 level before resuming the uptrend backed by more buying pressure.
3. XRP
While a majority of major coins rallied in tandem with Bitcoin, the XRP price showcased waning bullish momentum this week. From the last swing low of $0.534, the coin price jumped 11% to current trade at $0.59.
The sixth-largest cryptocurrency XRP has been riding a slow yet steady recovery since last month under the influence of an ascending trendline. The dynamic support uplifted the asset during minor dips keeping the recovery intact to reach $0.59 as the press time.
If the buyers fail to sustain above the breached trendline, the XRP price may fall back to the lower trendline to recuperate strength. Until the rising support is intact, the traders can prolong the ongoing recovery trend.
4. Dogecoin (DOGE)
The cryptocurrency market witnessed an aggressive bullish trend in late February as massive inflows from the spot ETF uplifted the underlying asset BTC. In tandem with the Bitcoin price rally, the altcoins prolonged their recovery trend, including Dogecoin which rose from $0.082 to $0.1, registering 48.5% growth. This swing provides a massive breakout from the long-coming triangle pattern indicating a major shift in market dynamics.
An analysis of the daily time frame chart shows the Dogecoin price has been traveling a sideways trend for the past 22 months. This lateral movement confined within two converging trendlines indicates the formation of a symmetrical triangle pattern.
In theory, this chart pattern developed to indicate the notable period of consolidation whose result determined the dominant force in the market. Amid the recent upsurge in the crypto market, the DOGE price gave a decisive breakout from the upper boundary signal, the buyers are regaining control over this asset.
Related Articles


